The SciEng C++ Library
I know that most people doing science use Python as their day-to-day scripting language for making plots, analysing data and generally doing science. However, when I learned to code, Python was practically unheard of and C++ was the flavour of the hour. If you want to write high performance code, C++ and Fortran are still the go to languages, and the game industry widely uses C++. Here’s why I use C++ in my day-to-day coding
- I know it – you can call me a luddite, but I know it well enough to do almost anything in it, so it’s quite hard to justify changing.
- It’s compiled – the process of compilation does a lot of error checking for you and this means you can catch many errors at compile time, rather than at run time
- It’s fast – well, that’s the reputation. You can still write slow C++ code and you can write fast python code (although that normally means calling functions written in C++)
- It’s compatible with Python – The CTypes library means you can write code in C++ that you can then call from Python
- The tools are mature – While VS code is gaining traction in scripting, the full Visual Studio editor has been around since the 90s and is by far the smoothest coding experience I’ve ever found
- It’s free – So is python, but that’s not the case for things like MatLab and IDL
- It’s backwards compatible – A new version of C++ is being released every 3 years, but there is a massive effort to ensure there are almost no backwards incompatible changes. I’m sure some people reading this will recall the pain of upgrading to Python 3.
- I know it – did I mention I know it?
Now you know why I use C++, lets get into what Sci Eng does.
So what is SciEng?
SciEng is a library of code that I have built up over the years. It’s the stuff that helps me code things up quickly and efficiently and it helps me avoid bugs. Here are some of the things it can do.
Graphics and Plots
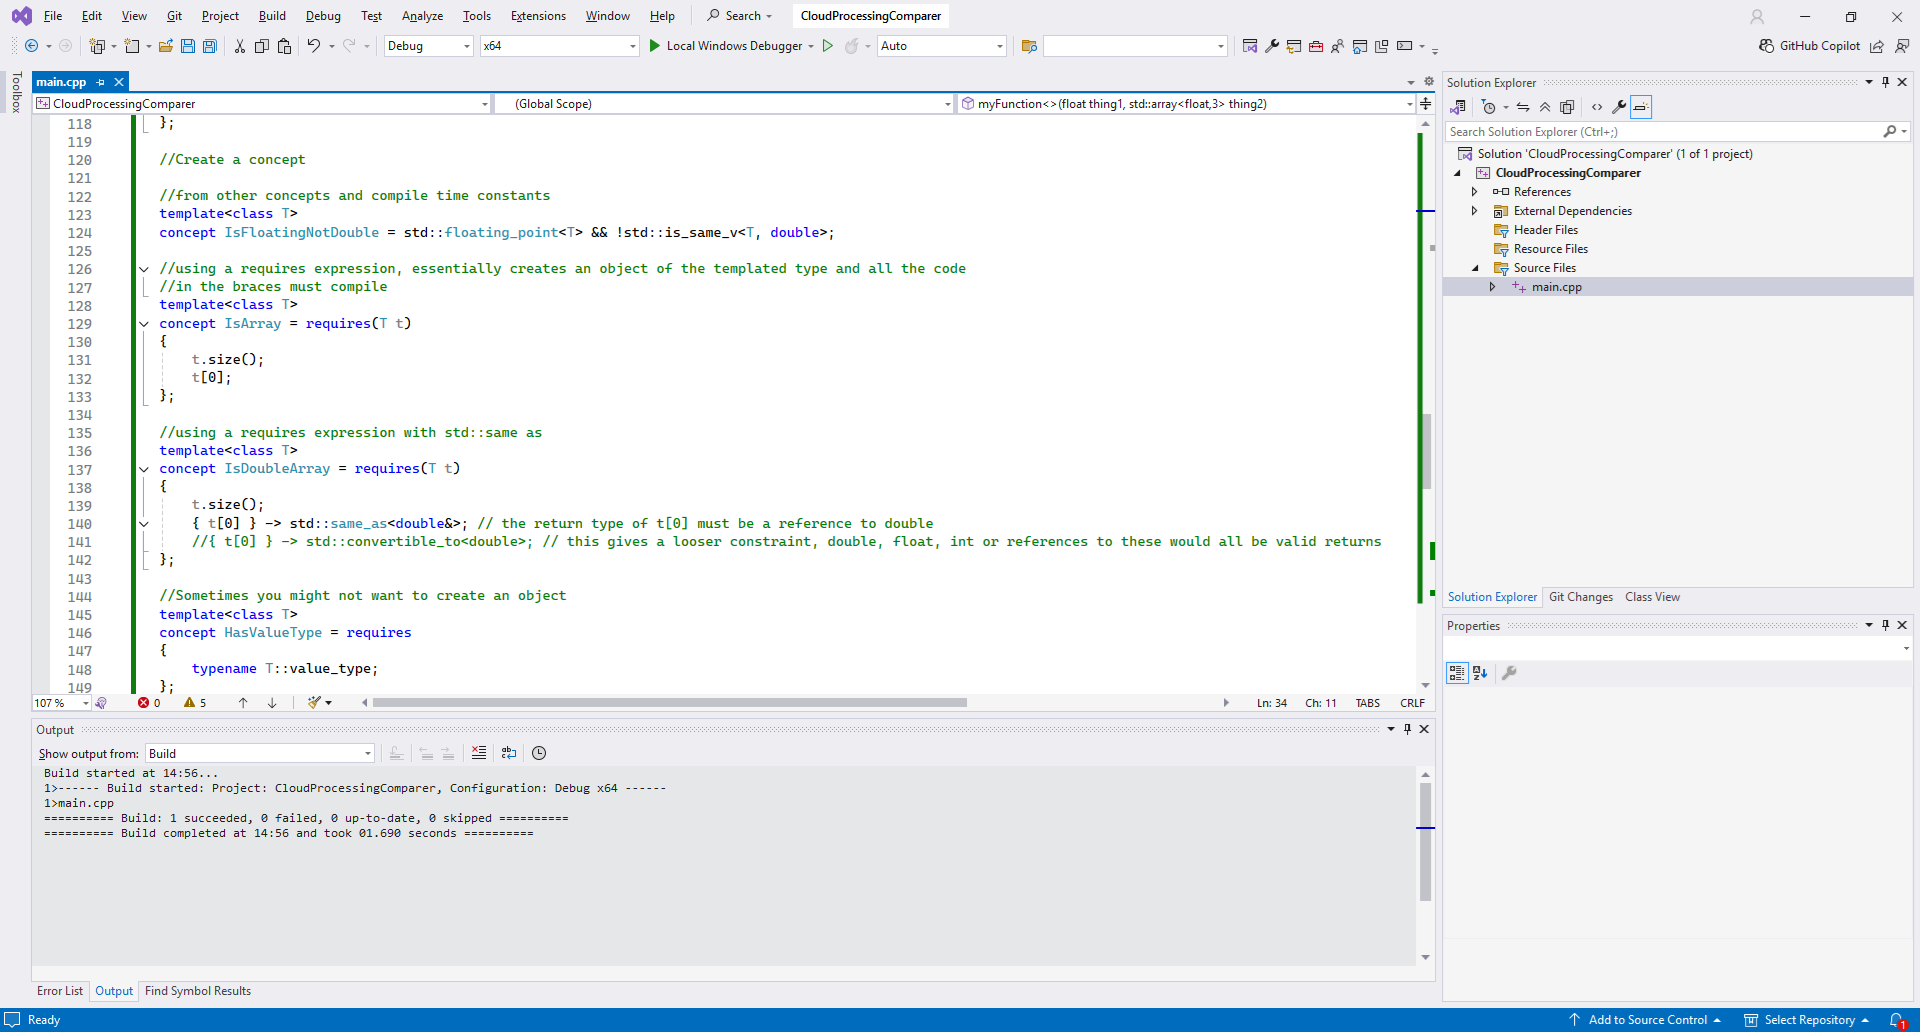
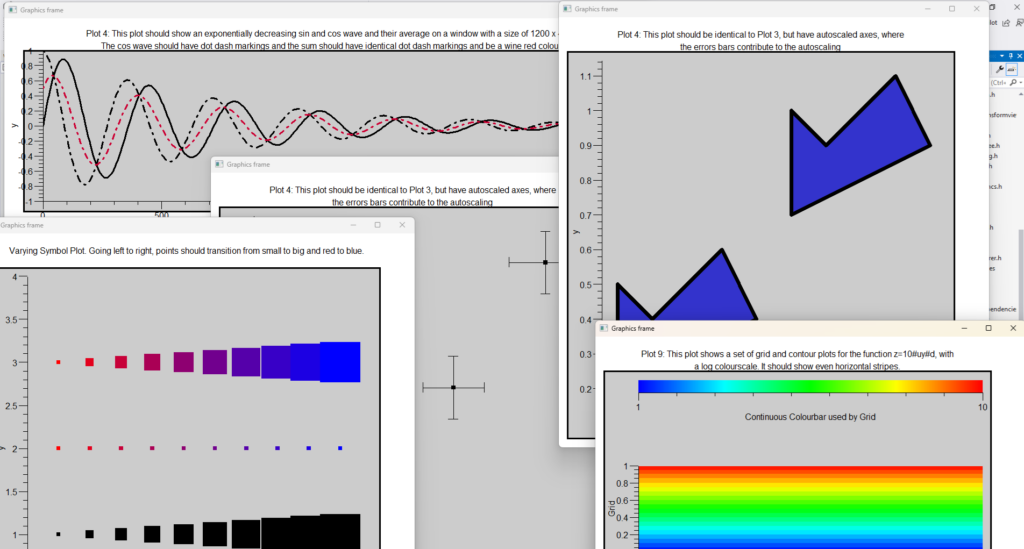
SciEng provides plotting functionality and the ability to draw vector graphics. I’ll be honest and say that this part of the library is the least mature and undergoing the most development. But also I think it’s the thing that scientists struggle with most when they want to use C++, so I wanted to put it up top. Right now it is built upon the graphics engine provided by an external library called wxWidgets. Hopefully I’ll have something independent built soon to avoid using an extra library. Here’s an example
//make the interactive window and grab its drawing canvas
auto frame = sci::plot::makeWxPlotFrame(this);
auto canvas = frame->getPanel()->getCanvas();

//create some data to plot
std::array<double, 3> xs{ 0.1, 0.5, 0.8 };
std::array<double, 3> ys{ 0.2, 0.4, 0.6 };

//Create points for the axes ends
sci::graphics::Point origin(unitless(0.1), unitless(0.9));
sci::graphics::Point xAxisEnd(unitless(0.9), unitless(0.9));
sci::graphics::Point yAxisEnd(unitless(0.1), unitless(0.1));

//Create the x and y axes
auto xAxis = sci::plot::makeAxis<double>(0.0, 1.0, false, origin, xAxisEnd);
auto yAxis = sci::plot::makeAxis<double>(0.0, 1.0, false, origin, yAxisEnd);

//Create the points, setting the axes they will be plotted against
auto points = sci::plot::makePoints(xs, ys, xAxis, yAxis, sci::plot::Symbol(), sci::graphics::RgbColour());

//Add the elements to the plot
canvas->addItem(xAxis);
canvas->addItem(yAxis);
canvas->addItem(points);

//display the plot
frame->Show();
I’m aware this bit of the library is still a bit verbose, and one of my next jobs is to add in some functions that mean you can make quick and easy default-styled plots in just a couple of lines. Here is a screenshot showing some test plots I’ve been using to debug the code.
Multi-D Arrays
SciEng includes a class called GridData. This class holds data in a multi-d array. You use it something like this
std::array<size_t, 2> shape{3, 4};
sci::GridData<double, 2> myData(shape);
myData[2][1] = 3.5;
This creates a 2-d array of doubles with a shape of 3 x 4. Initially all the elements are set to zero, then element [2][1] gets set to 3.5.
While this might seem a bit basic, C++ never came with a proper multi-d array. SciEng provides one.
Maths on arrays
SciEng allows you to do elementwise maths on arrays. So you can do
std::array<size_t, 2> shape{3, 4};
sci::GridData<double, 2> myData1(shape);
sci::GridData<double, 2> myData2(shape);
sci::GridData<double, 2> myData3(shape);

//some code to set all the values of the arrays

sci::GridData<double, 2> myData4= 2.0 / myData1 + myData2 * myData3;
Again this isn’t something C++ does natively.
Units
I have made countless errors in the past with units. This was one of the first things a built as part of SciEng. So now if you do something like this
metre myLength1(5.0);
millimetre myLength2(350);
millimetre myLength3 = myLength1 + myLength2;
Then the result in myLength3 will be 1350. It does the conversion automatically.
Also if you try
metre length(5.0);
ohm resistance(2.0);
auto badThing = length + resistance;
Then it will give you a compilation error.
The library knows the 7 physical dimensions, plus angles. It can also divide, multiply and raise units to powers. So you can divide a metre by a second to get a metre per second.
The cool thing about C++ beig a compiled language is that all these checks are done when you hit the compile button, so it will immediately give you an error if you’ve done something non-physical. This library has saved me on countless occasions when I’ve made stupid mistakes like dividing instead of multiplying by a constant.
Time and calendars
As a field scientist I need to be able to easily deal with observations that vary in both space and time. It can be a real pain to deal with time, dealing with ticking past midnight, or into a new month or year. Also, have you ever had trouble dealing with synchronising two data sets that claim to be using UTC, only to realise that one forgot about leap seconds? I have. How many times have you had to read in the text of a date and time and convert it to some numerical value? Or how many times did you need to write that same bit of code to convert a numerical date into text for a file name or header?
The UtcTime class lets you deal with all of that stuff. It interacts with the units classes so that you can add a duration to a point in time or subtract two points in time to get a duration. It’s one of those classes that I would not have said has been essential for me, but it’s been a massive time saver.
Where to get it if you want it?
The library is on GitHub at https://github.com/philrosenberg/sci. It is a header only library which means there is nothing to compile. Once you have put the headers in you usual header location for your system you can just use include statements to pull in the bits of the library that you need. The licence is as free as it can be and lets you use it for pretty much whatever you want, commercial or open source. If you find a bug, please report it, and hopefully this can be a tool that will help others as much as it helped me.
Phil Rosenberg